

前言
软件工程的第一个作业——使用编程实现 PERT 图,在此分享我的实现思路。
代码开源地址:https://github.com/Aki-Hoyue/projects/tree/main/SE/PERT
PS:如果有能力,建议观看 GitHub 中的英文版报告,因为一开始写的就是英文版,本篇可能有些地方有翻译痕迹。 如果对代码部分有任何问题,欢迎留言讨论。
介绍与环境
计划评审技术(英语:Program Evaluation and Review Technique,简称 “PERT”),主要目的是针对不确定性较高的工作项目,以网络图规划整个专案,以排定期望的专案时程。PERT 图把项目描绘成一个由编号结点(圆形或者方形)构成的网络图,编号节点代表着项目中的任务。每个结点都被编号,并且标注了任务、工期、开始时间和完成时间。线条上的箭头方向标明了任务次序,并且标识出在开始一个任务前必须完成那些任务。
该评审技术的主轴为“乐观时间”、“最有可能时间”及“悲观时间”。
最核心公式为 “专案期望时间” = 。
我使用的是 Python 进行编程,需要的环境有:
- Python 3.x 及更高版本
- 至少需要以下 Python 包:
os:提供文件操作json:提供 JSON 文件操作math:提供一些数学函数scipy.stats:提供统计函数和分布networkx:创建、操作和分析复杂网络图matplotlib.pyplot:提供用于创建可视化效果的函数queue:提供用于实现队列的类tabulate:从数据创建格式化的表格,便于清晰展示数据
推荐使用 Anaconda,一个集成环境,安装具体可以看: https://hoyue.fun/algorithm_pyinstall.html
使用说明
数据文件默认数据文件为 data.json,与代码在同一目录下。
它遵循 JSON 格式,是一个列表,其中每个节点都是一个字典,字典的示例格式是:
{ "Activity Code": "A", "Immediate Predecessor": ["B", "C"], "Optimistic Estimate": 12, "Most Likely Estimate": 15, "Pessimistic Estimate": 18}对于每个活动的前置,如果它不存在则是一个空列表 []。除此之外,我在文件夹中还提供了两个测试数据:data1.json(与 data.json 数据相同),data2.json。
在终端中运行程序,会显示一个菜单。如图:
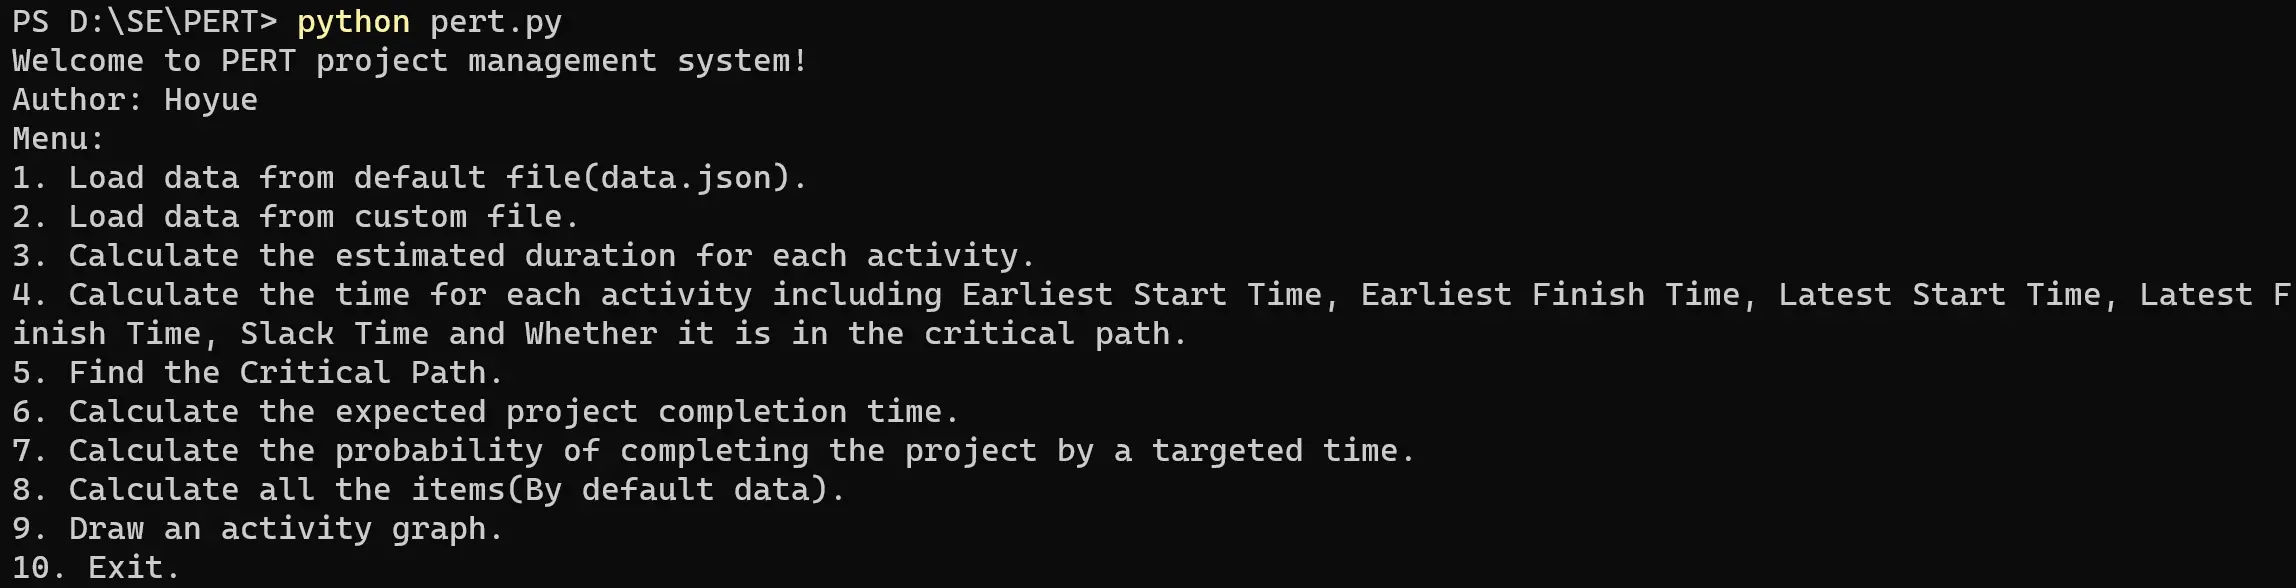
你在进行计算前,必须先加载数据文件。按 1 或 2 以加载文件。
- Press 1: 加载默认文件
data.json - Press 2: 加载一个自定义文件,该文件位于程序的同一文件夹或给出绝对路径。例如:
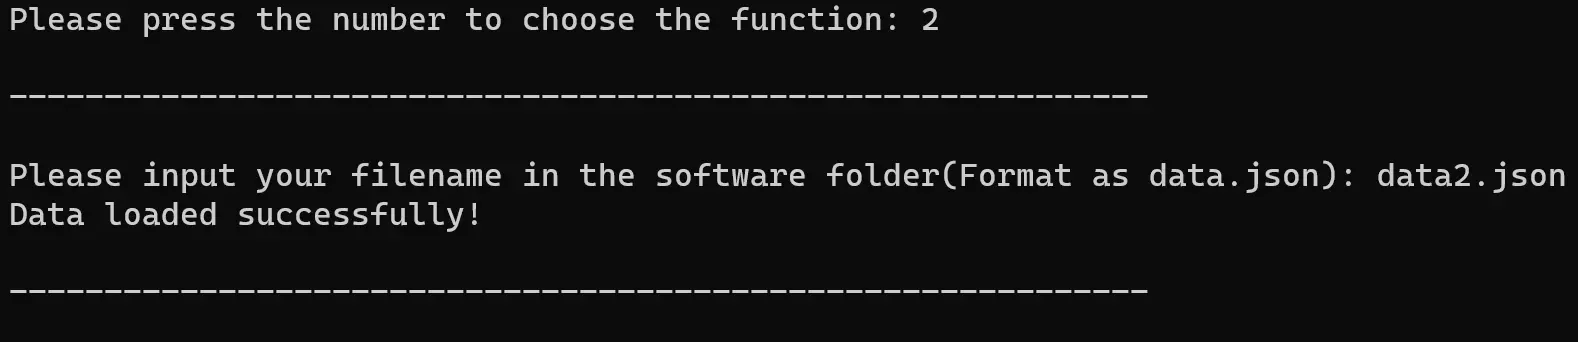
成功加载文件后,你将看到通知:Data loaded successfully!(数据加载成功!),并回到菜单上。
如果输入了错误的文件,程序将报告错误并退出。
然后,你可以选择选项 3 - 9 来实现相应的功能。示例(使用数据文件 data2.json):
-
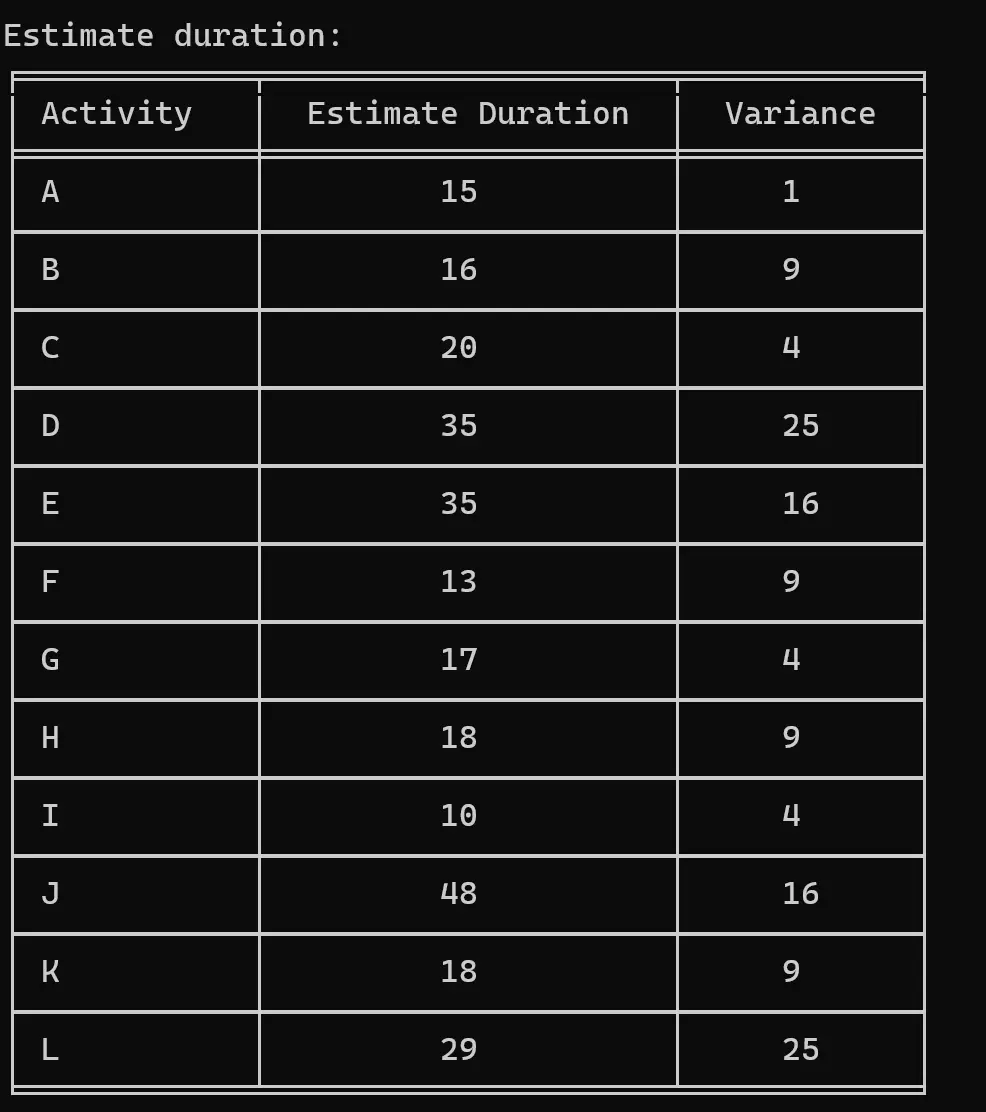
Press 3: 计算每项活动的预计持续时间(Calculate the estimated duration for each activity.)
-
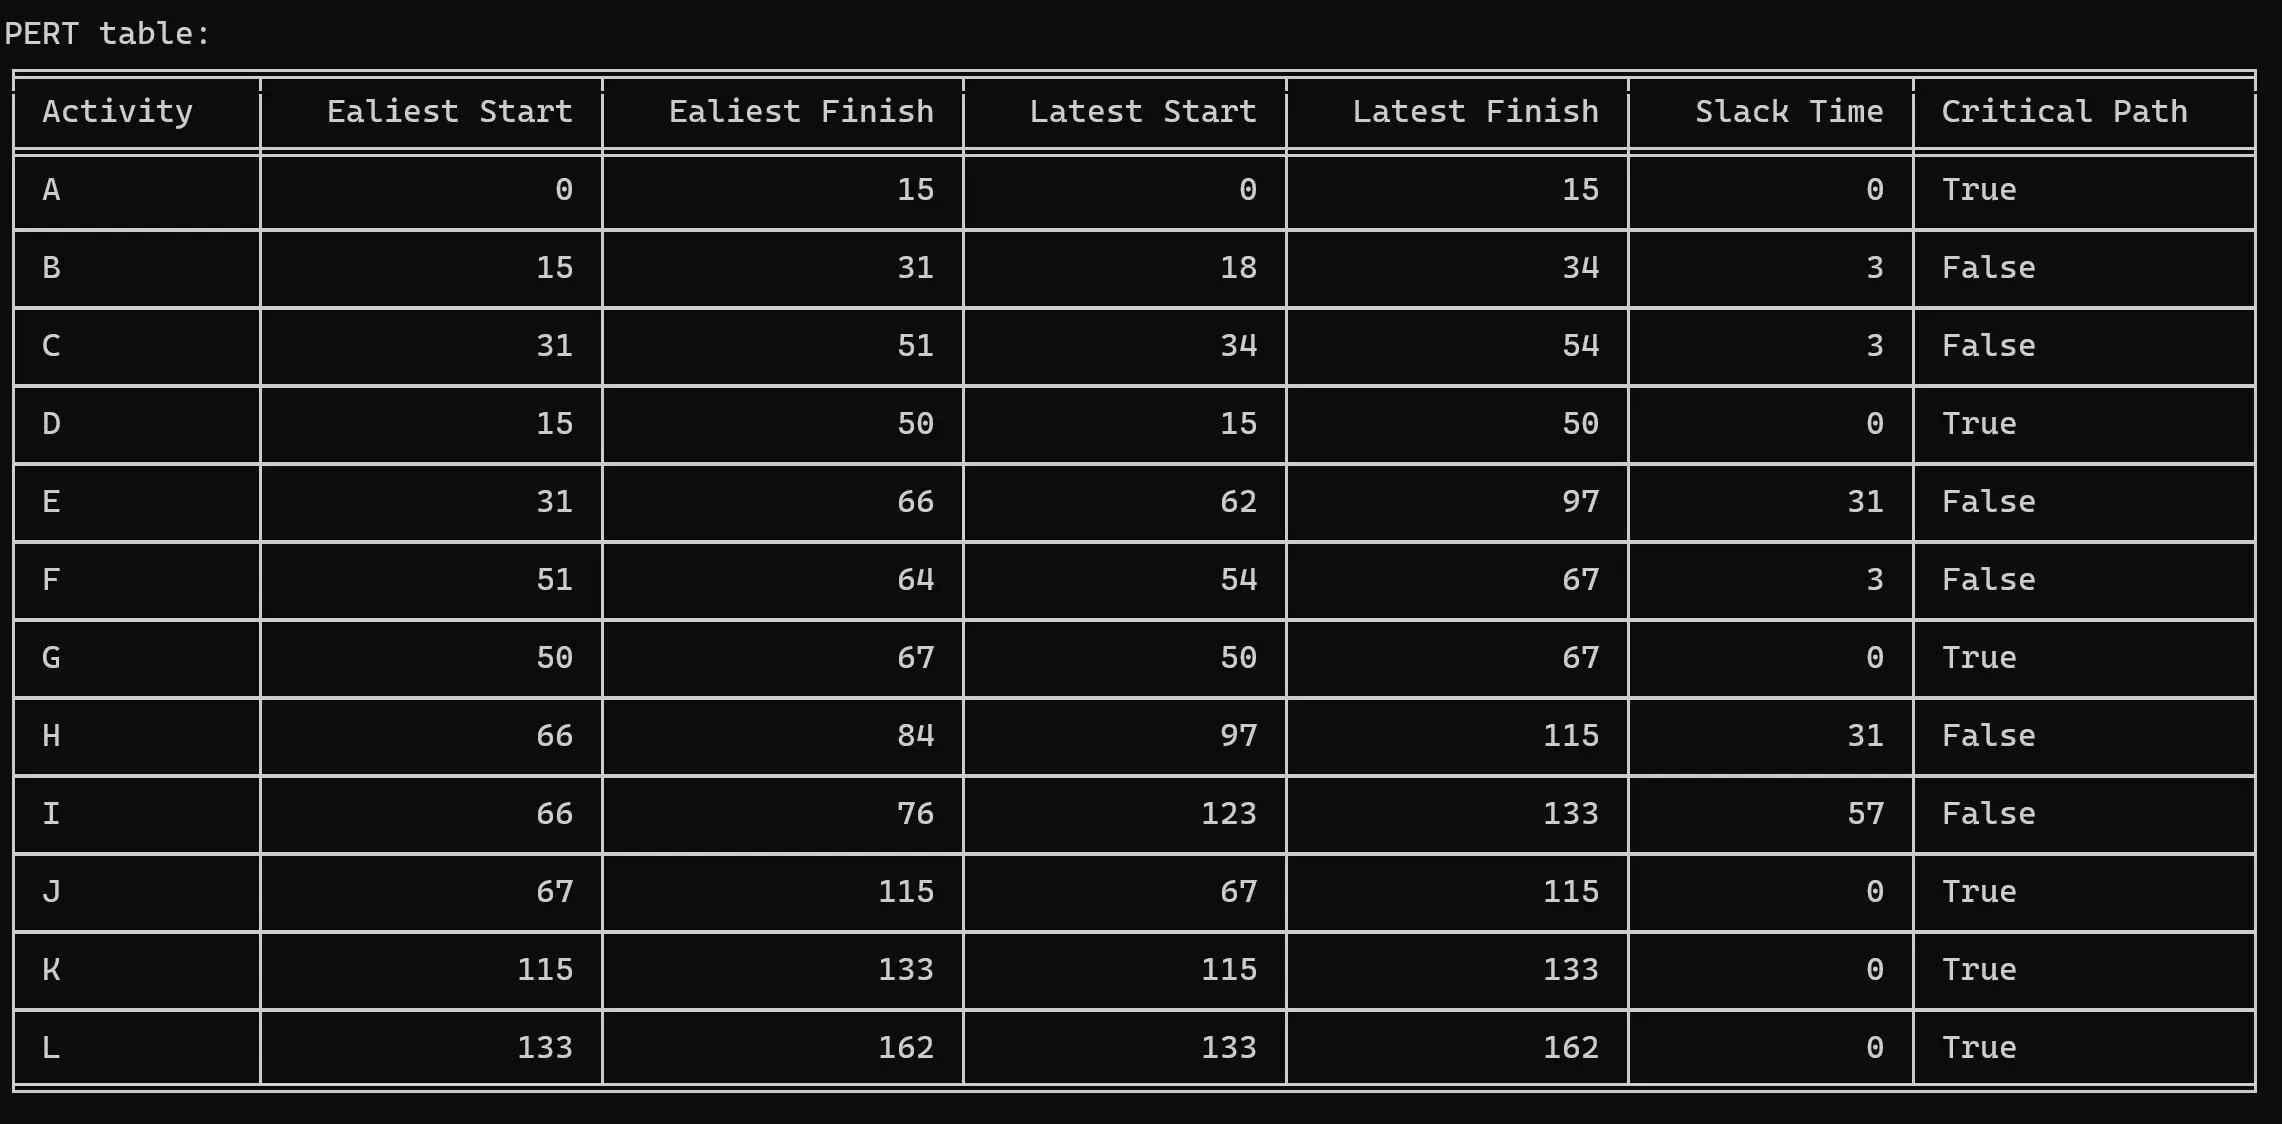
Press 4: 计算每个活动的时间,包括最早开始时间、最早完成时间、最晚开始时间、最晚完成时间、松弛时间以及是否处于关键路径中(Calculate the time for each activity including Earliest Start Time, Earliest Finish Time, Latest Start Time, Latest Finish Time, Slack Time and Whether it is in the critical path.)
-
Press 5: 找到所有的关键路径(Find the Critical Path.)

-
Press 6: 计算期望项目完成时间(Calculate the expected project completion time.)

-
Press 7: 计算在目标时间内完成项目的概率(Calculate the probability of completing the project by a targeted time.)
假设我们计算在大于 145 天内完成项目的概率。我们输入目标时间为 145,分布模式为 l(larger)。

-
Press 8: 计算所有项目(使用默认数据)
如果不加载文件,它将加载默认数据并在项之前显示。如果你已经加载了一个文件,它将根据你的数据进行计算。
-
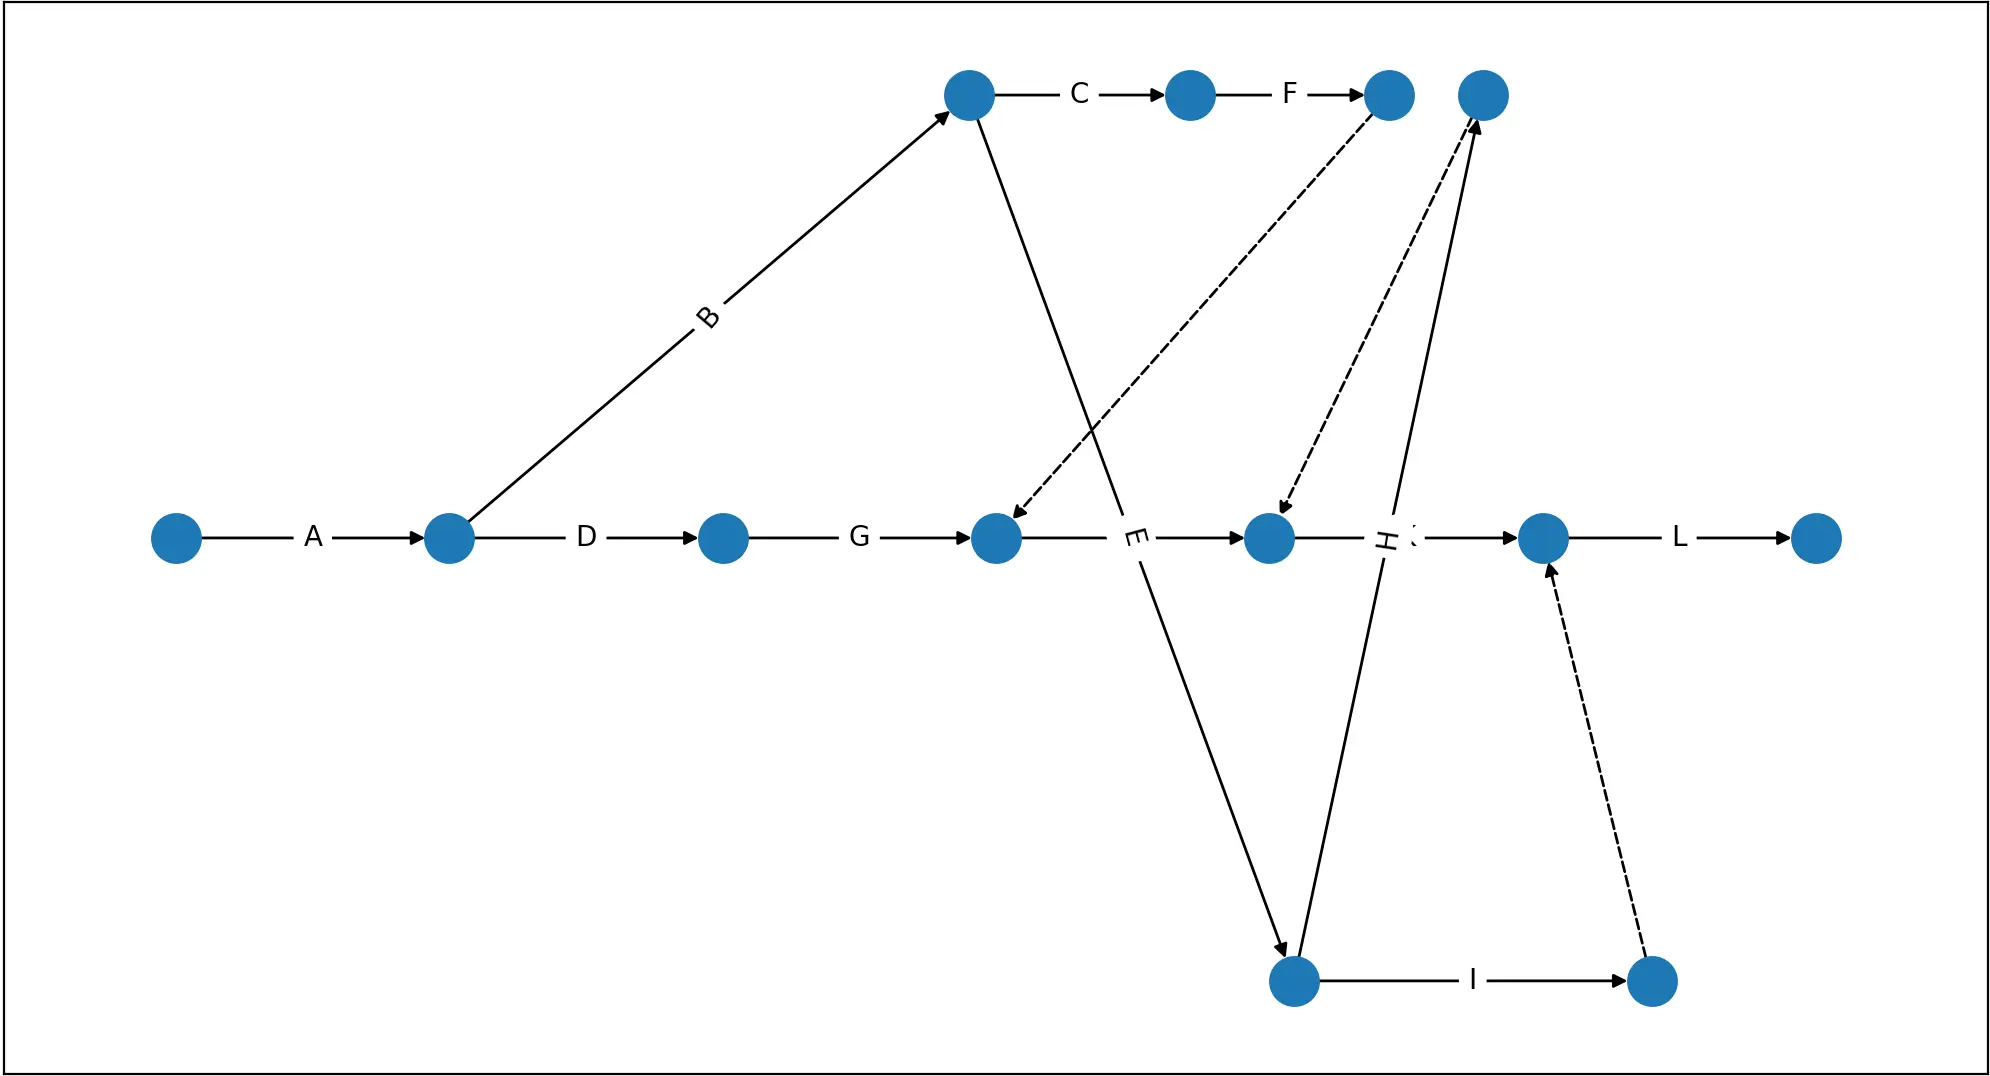
Press 9: 展示活动拓扑图,将在一个新的窗口中打开(Draw an activity graph.)
-
Press 10: 退出 / Exit.
设计思路
存储设计
设计存储的时候,我设计了一个列表 PERT 去存储输入的数据。每一项都是一个字典,初始化为 PERT = []。
同时定义一个类 Graph,其构造函数将类 Graph 的每个对象初始化为一个空字典 graph,以获取有关此图的信息。
在类中的存储,我使用字典里嵌套字典的方式,便于遍历和存储信息。初始化代码如下:
# Define an array to store data and each item is a dictionaryPERT = []
class Graph: def __init__(self): self.graph = {}在函数 file_load 中,它从 JSON 文件中读取数据并将其存储在 PERT 数组中。file_load 的参数是一个数据文件目录,可以通过用户输入传入,默认值为 data.json。
在设计中,首先确定路径,如果路径不存在,则返回错误消息,否则将读取的数据存储在临时变量 data 中。
下一步是遍历整个 data,一次读入一个字典。Optimistic Estimate、Most Likely Estimate 和 Pessimistic Estimate 数据可用于使用公式直接计算 Estimate During 和方差。这些信息将作为 PERT 表的元素写入。
最后,返回 1,表示文件内容已成功读取。
# Load data from json filedef file_load(filename="data.json"): if os.path.exists(filename): with open(filename, "r") as data_table: data = json.load(data_table) else: print("Error, file not found!") print_separator() return 0
# Iterate through data for item in data: activity_code = item['Activity Code'] immidiate_predecessor = item['Immediate Predecessor'] # An array optimistic_estimate = item['Optimistic Estimate'] most_likely_estimate = item['Most Likely Estimate'] pessimistic_estimate = item['Pessimistic Estimate'] estimate_during = (optimistic_estimate + 4 * most_likely_estimate + pessimistic_estimate) / 6 variance = ((pessimistic_estimate - optimistic_estimate) / 6) ** 2
PERT.append({ "activity code": activity_code, "immidiate_predecessor": immidiate_predecessor, "estimate_during": estimate_during, "variance": variance }) return 1读入数据后,我们仍然需要将数据加载到 Graph 类中,我在 Graph 类中设计了成员函数 add_activity。它的参数是存储输入的表 PERT。
在添加数据到图中时,除了添加一些必要的信息外,我还设计了 next_activity 列表来存储活动的后驱节点,这样就可以很容易地找到 earliest start 和 earliest finish。
# Add a node to the graphdef add_activity(self, PERT): immidiate_predecessor = PERT['immidiate_predecessor'] time = PERT['estimate_during'] variance = PERT['variance'] # Set predecessor to the new node. Next_activity is an array that stores the next activity. for i in immidiate_predecessor: if i in self.graph: self.graph[i]["next_activity"].append(PERT['activity code']) # Add the new node to the graph self.graph[PERT['activity code']] = { "activity_code": PERT['activity code'], "estimate_during": time, "variance": variance, "next_activity": [], "before_activity": immidiate_predecessor, "earliest_start_time": 0, "earliest_finish_time": 0, "latest_start_time": 0, "latest_finish_time": 0, "slack_time": -1, "critical_path": False }计算最早开始和最早完成时间
在函数 earliest_time 中,我们初始化没有前驱的节点作为起点,然后通过遍历后驱来依次计算 ES 和 EF。
在第一层循环中,逐个迭代对象 graph 字典中的活动名,在第二层循环中,循环遍历当前活动的后驱,如果后驱的 ES 小于当前节点的 EF,则后驱的 ES 被替换为当前节点的 EF,并重新计算后驱的 EF。
在循环结束时,所有活动的 ES 和 EF 都已经计算完毕。
# Calculate the earliest start time and earliest finish timedef earliest_time(self): # Initialize the earliest start time and earliest finish time for i in self.graph: if self.graph[i]["before_activity"] == []: self.graph[i]["earliest_finish_time"] = self.graph[i]["estimate_during"] # Caculate the earliest start time and earliest finish time for i in self.graph: for j in self.graph[i]["next_activity"]: if self.graph[j]["earliest_start_time"] < self.graph[i]["earliest_finish_time"]: self.graph[j]["earliest_start_time"] = self.graph[i]["earliest_finish_time"] self.graph[j]["earliest_finish_time"] = ( self.graph[j]["earliest_start_time"] + self.graph[j]["estimate_during"] )计算最晚开始和最晚完成时间
在函数 latest_time 中,我们同样先将没有后驱的节点初始化,它们的 LF 都是最大的 LF。故我们需要先找到最大的 EF 才能找到最大的 LF。
在第一层循环中,倒序遍历活动名;第二层循环,循环遍历当前活动的前驱节点,如果前驱节点的 LF 大于当前节点的 LS,则前驱节点的 LF 会被当前节点的 LS 取代,并重新计算该节点的 LS。
最后,循环结束时会计算出所有活动的 LS 和 LF。
# Calculate the latest start time and latest finish timedef latest_time(self): # Initialize the latest start time and latest finish time estimate_time = 0 for i in reversed(self.graph): if self.graph[i]["next_activity"] == []: estimate_time = max(estimate_time, self.graph[i]["earliest_finish_time"]) self.graph[i]["latest_finish_time"] = estimate_time self.graph[i]["latest_start_time"] = ( self.graph[i]["latest_finish_time"] - self.graph[i]["estimate_during"] )
# Calculate the latest start time and latest finish time for i in reversed(self.graph): for j in self.graph[i]["before_activity"]: if self.graph[j]["latest_finish_time"] == 0 or \ self.graph[j]["latest_finish_time"] > self.graph[i]["latest_start_time"]: self.graph[j]["latest_finish_time"] = self.graph[i]["latest_start_time"] self.graph[j]["latest_start_time"] = ( self.graph[j]["latest_finish_time"] - self.graph[j]["estimate_during"] )计算松弛时间
计算松弛时间(slack time)非常简单,只需计算每个项目的 LS - ES 即可。
# Calculate the slack time LS-ESdef slack_time(self): # Calculate the slack time for i in self.graph: self.graph[i]["slack_time"] = ( self.graph[i]["latest_start_time"] - self.graph[i]["earliest_start_time"] )计算关键路径
确定一项活动是否为关键路径(critical path)也非常简单:如果活动的松弛时间为 0,则它是关键路径,否则不是。
# Calculate the critical path that Slack = 0def critical_path(self): # Calculate the critical path for i in self.graph: if self.graph[i]["slack_time"] == 0: self.graph[i]["critical_path"] = True输出
本部分是输出的集合,用于打印上述函数的结果。
首先,我们应该在输出之前执行那些计算函数,以便为输出提供足够的数据。在函数初始化中调用这些计算函数 initization。
# Initialization before printingdef initization(self): self.earliest_time() self.latest_time() self.slack_time() self.critical_path()然后我们输出 Estimate duration,将其输出为表格,使用 tabulate 模块进行制表,将每个活动的数据写入 Estimate_table,并设置标题和表格格式。
# Print the Estimate durationdef print_estimate_duration(self): print("Estimate duration: ") Estimate_table = [["Activity", "Estimate Duration", "Variance"]] for i in self.graph: Estimate_table.append([ self.graph[i]["activity_code"], self.graph[i]["estimate_during"], self.graph[i]["variance"] ]) print(tabulate(Estimate_table, headers="firstrow", tablefmt='fancy_grid', numalign="center"))同理,将必要的数据写入 table 中,输出 ES, EF, LS, LF 等内容,并设置标题和表格格式。
# Print the earliest/latest start time and finish timedef print_PERTtable(self): print("PERT table: ") table = [["Activity", "Ealiest Start", "Ealiest Finish", "Latest Start", "Latest Finish", "Slack Time", "Critical Path"]] for i in self.graph: table.append([ self.graph[i]["activity_code"], self.graph[i]["earliest_start_time"], self.graph[i]["earliest_finish_time"], self.graph[i]["latest_start_time"], self.graph[i]["latest_finish_time"], self.graph[i]["slack_time"], self.graph[i]["critical_path"] ]) print(tabulate(table, headers="firstrow", tablefmt='fancy_grid'))输出关键路径,用 -> 连接每个关键路径:
# Print the critical pathdef print_critical_path(self): print("Critical path: ") for i in self.graph: if self.graph[i]["critical_path"]: print(self.graph[i]["activity_code"], end=" ") if self.graph[i]["next_activity"] != []: print("->", end=" ") print()在输出预计项目完成时间时,需要通过 keys() 属性找到最后一个最大的 LF/EF 并输出。
# Print the expected project completion timedef print_expected_project_completion_time(self): keys = list(self.graph.keys()) print("Expected project completion time: %s" % self.graph[keys[-1]]["latest_finish_time"])计算概率
为了计算目标完成时间比实际完成时间 larger/smaller (l/s) 的概率,设计了函数 probability。它有两个参数,一个是目标完成时间 targeted,另一个是分布模式,可以是 larger/smaller (l/s)。
基于公式 Standard Deviation 和 Z-Score 可以计算,概率可以基于 scipy.stats 模块计算。
# Calculate the probability of completing the project. mode = larger/smallerdef probability(self, targeted, mode): if mode == "l": mode = "larger" elif mode == "s": mode = "smaller"
var_sum = 0 for i in self.graph: if self.graph[i]["critical_path"]: var_sum += self.graph[i]["variance"]
standard_deviation = math.sqrt(var_sum) keys = list(self.graph.keys()) expected = self.graph[keys[-1]]["latest_finish_time"] zscore = (targeted - expected) / standard_deviation
if mode == "larger": probability = 1 - st.norm.cdf(zscore) else: probability = st.norm.cdf(zscore)
print("Z-score: {}\nProbability of project completion {} than {} is: {:.2%} ({}). " .format(zscore, mode, targeted, probability, probability))画图
在函数 graph_table 中,G 用作网格图,graph_dict 作为对象的 graph,而队列 Q 则被设计用于使用 FIFO 中生成节点和边。pos 作为一个 map 来存储每个节点的坐标,postion 字典记录了每个节点的 row 和 col 以便生成之后节点的坐标。
首先,我先生成一条由多个关键路径组成的直线,用于代表 关键路径,初始节点坐标为 (0, 0),依次加 1 并添加边,并附上边的标签(活动名称)。对于添加的每个节点,该节点都会进入队列,以便此后可以按照顺序生成其子节点。
接下来设置一个指向第一个节点的初始化节点(Start)。
接着,生成非关键路径的节点。一个节点根据其后驱节点的数量生成一个 range_col,它代表其后驱节点纵坐标的最大值,每个后驱节点的纵坐标相差 1。当只有一个后驱的情况下,其后驱节点的纵坐标与当前节点相同。
特殊情况:如果当前节点没有后驱并且不是最后一个关键路径节点,则它指向最后一个关键路径节点(说明它是最后一位节点并直接指向 END)。
接下来遍历当前节点的所有后驱,如果后驱不在已添加的节点列表中,则添加它,添加实线边并将后驱入队。
否则,判断当前节点的 EF 和后驱节点 ES 的大小,如果当前节点的 EF 较大,则需要将后代节点的原有的边设置为虚线,并添加新的实线边;如果后驱节点的 ES 很大,则直接添加虚线边。
这里有一个特别判断,如果当前节点的 EF 和后驱节点的 ES 大小相同,则需要将后代节点原来的非关键路径的边设置为虚线,并添加实线边。
最后通过 matplotlib.pyplot 和 networkx 模块分别绘制节点、边以及边的标签,并最终展示出来。
# Graph the tabledef graph_table(self): graph_dict = self.graph G = nx.DiGraph() pos = {} Q = queue.Queue() postion = {}
# Set the critical path row = 0 for i in graph_dict: if graph_dict[i]["critical_path"]: Q.put(graph_dict[i]["activity_code"]) G.add_node(graph_dict[i]["activity_code"]) postion[graph_dict[i]["activity_code"]] = {"row": 0, "col": 0} pos[graph_dict[i]["activity_code"]] = (row, 0) row += 1 postion[graph_dict[i]["activity_code"]]["row"] = row postion[graph_dict[i]["activity_code"]]["col"] = 0 for j in graph_dict[i]["before_activity"]: if j in G.nodes(): G.add_edge(graph_dict[j]["activity_code"], graph_dict[i]["activity_code"], name=graph_dict[i]["activity_code"])
# Set the startpoint and endpoint G.add_node("Start") pos["Start"] = (-1, 0) G.add_edge("Start", Q.queue[0], name=Q.queue[0]) last_critical_point = Q.queue[Q.qsize() - 1]
dash = [] # Set the non-critical path while not Q.empty(): cur = Q.get()
if len(graph_dict[cur]["next_activity"]) > 1: range_col = math.floor(math.log2(len(graph_dict[cur]["next_activity"]))) elif len(graph_dict[cur]["next_activity"]) == 1: range_col = postion[cur]["col"]
if graph_dict[cur]["next_activity"] == [] and cur != last_critical_point: G.add_edge(cur, last_critical_point) dash.append((cur, last_critical_point)) continue
for next_node in graph_dict[cur]["next_activity"]: if next_node not in G.nodes(): G.add_node(next_node) col = range_col row = (postion[cur]["row"]) * (1 - (col / 10.0)) + 1 postion[next_node] = {"row": row, "col": col} pos[next_node] = (row, col) range_col -= 1 if range_col == 0: range_col -= 1 G.add_edge(cur, next_node, name=next_node) Q.put(next_node) else: cur_EF = graph_dict[cur]["earliest_finish_time"] next_ES = graph_dict[next_node]["earliest_start_time"] if cur_EF > next_ES: pred = list(G.predecessors(next_node)) for j in range(len(pred)): G.remove_edge(pred[j], next_node) G.add_edge(pred[j], next_node) dash.append((pred[j], next_node)) G.add_edge(cur, next_node, name=next_node) elif cur_EF < next_ES: for j in graph_dict[next_node]["before_activity"]: if graph_dict[j]["critical_path"]: G.add_edge(cur, j) dash.append((cur, j)) else: pred = list(G.predecessors(next_node)) for j in range(len(pred)): if graph_dict[pred[j]]["critical_path"] and \ not graph_dict[cur]["critical_path"]: G.remove_edge(pred[j], next_node) G.add_edge(pred[j], next_node) dash.append((pred[j], next_node)) G.add_edge(cur, next_node, name=next_node)
# Draw the graph nx.draw_networkx_nodes(G, pos)
dashed_edges = [(u, v) for u, v in G.edges if (u, v) in dash] nx.draw_networkx_edges(G, pos, edgelist=dashed_edges, style='dashed')
solid_edges = [(u, v) for u, v in G.edges if (u, v) not in dash] nx.draw_networkx_edges(G, pos, edgelist=solid_edges, style='solid')
nx.draw_networkx_edge_labels( G, pos, edge_labels=nx.get_edge_attributes(G, 'name'), font_family="sans-serif", font_size=10 ) plt.show()辅助函数
程序中还有一些辅助函数,可以帮助生成和判断一些情况。
print_separator 函数用于生成分隔符以允许分隔重要的输出。
loading_test 函数用于测试数据是否已经加载,根据情况对其参数类型进行不同的分析。
- 当 Type = 0 时,函数会输出加载消息,返回 1 表示加载成功并输出成功消息,返回 0 表示已经加载。
- 当 Type = 2 时,情况与 Type = 0 非常相似,不同的是返回 1 时不执行任何操作。
- 当 Type = 1 时,会先检查是否需要加载。返回 1 表示已经加载,返回 0 表示需要先加载,并输出一条消息。
# Print separatordef print_separator(): print("\n------------------------------------------------------------\n")
# Loading test.def loading_test(type): if type == 0: # Type = 0 (load info -> return 1 (success) or 0 (already) for default file) if not PERT: print_separator() print("Data loaded successfully!") print_separator() return 1 else: print_separator() print("Data has been loaded!") print_separator() return 0 elif type == 1: # Type = 1 (check -> return 1 (ok) or 0 (need to load)) if not PERT: print_separator() print("Please load data first!") print_separator() return 0 else: print_separator() return 1 elif type == 2: # Type = 2 (for custom file like type 0) if not PERT: return 1 else: print_separator() print("Data has been loaded!") print_separator() return 0主函数
主要功能比较简单,主要是一个菜单,根据用户输入进行功能调用和反馈。
# Main function# InitializationPERT_graph = Graph()print("Welcome to PERT project management system!\nAuthor: Hoyue")while True: print("Menu: ") print("1. Load data from default file(data.json).") print("2. Load data from custom file.") print("3. Calculate the estimated duration for each activity.") print("4. Calculate the time for each activity including Earliest Start Time, Earliest Finish Time, Latest Start Time, Latest Finish Time, Slack Time and Whether it is in the critical path.") print("5. Find the Critical Path.") print("6. Calculate the expected project completion time.") print("7. Calculate the probability of completing the project by a targeted time.") print("8. Calculate all the items(By default data).") print("9. Draw an activity graph.") print("10. Exit.") choice = input("Please press the number to choose the function: ")
if choice == "1": if loading_test(0): if file_load(): for i in range(len(PERT)): PERT_graph.add_activity(PERT[i])
elif choice == "2": if loading_test(2): print_separator() filename = input("Please input your filename in the software folder(Format as data.json): ") if file_load(filename): for i in range(len(PERT)): PERT_graph.add_activity(PERT[i]) print("Data loaded successfully!") print_separator() elif choice == "3": if loading_test(1): PERT_graph.initization() PERT_graph.print_estimate_duration() print_separator() elif choice == "4": if loading_test(1): PERT_graph.initization() PERT_graph.print_PERTtable() print_separator() elif choice == "5": if loading_test(1): PERT_graph.initization() PERT_graph.print_critical_path() print_separator() elif choice == "6": if loading_test(1): PERT_graph.initization() PERT_graph.print_expected_project_completion_time() print_separator() elif choice == "7": if loading_test(1): PERT_graph.initization() print("For cauculating the probability of completing the project, please input the targeted time and distribution mode(larger/smaller).") targeted = float(input("Targeted time: ")) mode = input("Distribution mode(larger/smaller or l/s): ") if mode not in ("larger", "smaller", "l", "s"): print_separator() print("Error input! Please input again!") print_separator() continue PERT_graph.probability(targeted, mode) print_separator() elif choice == "8": if not PERT: file_load() for i in range(len(PERT)): PERT_graph.add_activity(PERT[i]) print_separator() PERT_graph.initization() PERT_graph.print_estimate_duration() PERT_graph.print_PERTtable() PERT_graph.print_critical_path() PERT_graph.print_expected_project_completion_time() print("For cauculating the probability of completing the project, please input the targeted time and distribution mode(larger/smaller).") targeted = float(input("Targeted time: ")) mode = input("Distribution mode(larger/smaller or l/s): ") if mode not in ("larger", "smaller", "l", "s"): print_separator() print("Error input! Please input again!") print_separator() continue PERT_graph.probability(targeted, mode) print_separator() elif choice == "9": if loading_test(1): PERT_graph.initization() print("Activity graph:") print("Notice: If you don't have some fonts installed, you may get an error, just ignore it.") PERT_graph.graph_table() print_separator() elif choice == "10": print("Thank you! Goodbye!") break else: print_separator() print("Error input! Please input again!") print_separator()限制
我在设计的时候,只考虑了默认顺序下输入的情况,如果输入的数据存在前驱位于后驱后面的情况,可能会出现问题。以及输出的时候只考虑了末位,如果改为随机数据时可以试试增加变量存储。
还有就是在画图的时候,子节点的 range_col 和 row 的生成公式可以自定义,我设计并不是最优的情况,可能导致图看起来没这么好看。
后记
这是我使用 Python 实现的 PERT 项目,练习 Python 非常合适。当然也可以使用 C++ / Java 等语言,核心思想都差不多。如果对代码部分有任何问题,欢迎留言讨论。
